Market Outlook
October 07, 2016
Market Cues
Domestic Indices
Chg (%)
(Pts)
(Close)
Indian markets are likely to open flat tracking global markets and SGX NIFTY.
BSE Sensex
(0.4)
(115)
28,106
Nifty
(0.4)
(34)
8,710
After recovering from an early move to the upside, the major US indices remained
Mid Cap
(0.6)
(76)
13,541
lackluster during the day on Thursday. The major indices remained broadly in
narrow range throughout the day ahead of monthly job data and finally ended the
Small Cap
(0.5)
(64)
13,226
day with slight negative note.
Bankex
(0.7)
(157)
22,159
The European markets closed marginally negative and traded in narrow range for
the day ahead of key job data to be announced by the US. Airlines and mining
Global Indices
Chg (%)
(Pts)
(Close)
stocks remained under pressure during the day.
Dow Jones
(0.1)
(12)
18,268
Indian markets closed with a negative note on Thursday amid profit booking. An
Nasdaq
(0.2)
(09)
5,307
upward move in crude oil and marginal weakening in the INR vs US $ could have
FTSE
(0.5)
(33)
7,000
raised some concern as well.
Nikkei
0.5
80
16,899
News Analysis
Hang Seng
0.7
164
23,953
Shanghai Com
0.2
6
3,005
Orient Cement acquires assets from Jaypee Group
Detailed analysis on Pg2
Advances / Declines
BSE
NSE
Investor’s Ready Reckoner
Advances
1,301
619
Key Domestic & Global Indicators
Declines
1,592
1005
Stock Watch: Latest investment recommendations on 150+ stocks
Unchanged
128
59
Refer Pg5 onwards
Top Picks
Volumes (` Cr)
CMP
Target
Upside
Company
Sector
Rating
BSE
3,674
(`)
(`)
(%)
Amara Raja Batteries Auto & Auto Ancill. Accumulate
1,040
1,174
12.8
NSE
22,271
HCL Tech
IT
Buy
801
1,000
24.8
Bharat Electronics
Capital Goods
Accumulate
1,272
1,414
11.2
Net Inflows (` Cr)
Net
Mtd
Ytd
Equitas Holdings
Financials
Buy
185
235
27.0
FII
504
612
50,617
Navkar Corporation Others
Buy
194
265
36.8
MFs
603
603
14,550
More Top Picks on Pg3
Key Upcoming Events
Top Gainers
Price (`)
Chg (%)
Previous
Consensus
Date
Region
Event Description
Reading
Expectations
Jppower
5
10.1
Oct 07 UK
Industrial Production (YoY)
2.10
1.30
Naukri
992
5.5
Oct 07 India
Industrial Production YoY
(2.40)
Ioc
649
5.4
Oct 07 US
Change in Nonfarm payrolls
151.00
174.00
Gppl
186
5.2
Oct 10 US
Unnemployment rate
4.90
4.90
Hindpetro
451
3.9
Oct 13 India
Imports YoY%
(14.09)
Oct 13 India
Exports YoY%
(0.30)
Oct 13 China
Exports YoY%
(2.80)
(3.30)
Top Losers
Price (`)
Chg (%)
6.(
More Events on Pg4
Ibrealest
89
(5.5)
Jindalstel
79
(5.1)
Redington
107
(3.8)
Hdil
81
(3.5)
Escorts
390
(3.3)
As on October 06, 2016
Market Outlook
October 07, 2016
News Analysis
Orient Cement acquires cement assets from Jaypee Group
Orient Cement has agreed to acquire assets from Jaypee Group. Under the
agreement Orient will acquire 74% stake held by Bhillai Jaypee Cement Ltd (BJCL).
BJCL is a JV between Jaiprakash Associates Ltd and SAIL. The company has a
cement manufacturing capacity of 2.2 mtpa, consisting of a clinkerisation unit in
Satna in Madhya Pradesh and has a grinding unit in Bhillai, Chattisgarh.
Orient also will acquire the Nigerie Cement Grinding Unit from “Jaiprakash Power
Ventures Ltd” (JPVL). The Nigerie unit in Singrauli area, M.P is housed within JVPL
and has a cement grinding unit with a capacity of 2.0 mtpa.
With the acquisitions the cement capacity of Orient will go upto 10.2 mn tons p.a
from current 8 mn tons p.a. Currently Orient Cement has two integrated plants
3 mn tons p.a at Devapur in Telangana and another 3 mn tons p.a unit at
Chittapur in Karnataka. It also has 2 mn ton p.a grinding unit at Jalgaon in
Maharastra.
The Enterprise Value (EV) of BJCL has been set at `1,450cr (EV/Ton of $ 99); while
the EV of Nigeri unit has been decide at `500cr (EV/ Ton of $ 38). The acquisition
allows Orient Cement to access the eastern markets where it was not present. As
per the management the Bhillai unit will be able to source clinker from the
Devapur plant, where the cost of production of clinker is lower compared to the
Satna region and also the freight cost also will be lower on a comparative basis.
While the acquisition will be funded via a mix of debt and equity, the company
doesn’t intend to exceed the debt/ equity ratio of 1.6x.
Economic and Political News
Govt raises `65,789cr via spectrum auctions
SIAM seeks same GST rate for small cars, MUVs
Minimum CAR set at 15% for payment banks-RBI
NSE board okays IPO via offer for sale
Corporate News
TRIL signs JV with Chinese company for manufacturing and marketing of
GIS/HGIS/TGIS systems
Hexware expands in Europe via a new global delivery system
M&M launched the country’s first zero emission electric cargo or passenger
van, the eSupro
Kotam Mahindra Bank reduces MCLR rates by 10 bps
Market Outlook
October 07, 2016
Top Picks ★★★★★
Large Cap
Market Cap
CMP
Target
Upside
Company
Rationale
(` Cr)
(`)
(`)
(%)
To outpace battery industry growth due to better technological
Amara Raja Batteries
17,770
1,040
1,174
12.8
products leading to market share gains in both the
automotive OEM and replacement segments.
Uptick in defense capex by government when coupled with
Bharat Electronics
30,532
1,272
1,414
11.2
BELs strong market positioning, indicate that good times are
ahead for BEL.
The stock is trading at attractive valuations and is factoring all
HCL Tech
1,13,044
801
1,000
24.8
the bad news.
Back on the growth trend, expect a long term growth of 14%
Infosys
2,35,816
1,027
1,370
33.4
to be a US$20bn in FY2020.
Source: Company, Angel Research
Mid Cap
Market Cap
CMP
Target
Upside
Company
Rationale
(` Cr)
(`)
(`)
(%)
Among the top 4 players in the consumer durables segment.
Bajaj Electricals
2,654
263
306
16.6
Improved profitability backed by turn around in E&P
segment. Strong order book lends earnings visibility.
With a focus on the low and medium income (LMI) consumer
Dewan Housing Finance
8,608
295
325
10.2
segment, the company has increased its presence in tier-II &
III cities where the growth opportunity is immense.
Strong loan growth backed by diversified loan portfolio and
adequate CAR. ROE & ROA likely to remain decent as risk of
Equitas Holdings
6,204
185
235
27.0
dilution remains low. Attractive valuations considering
growth.
Economic recovery to have favourable impact on advertising
& circulation revenue growth. Further, the acquisition of a
Jagran Prakashan
6,494
199
225
13.3
radio business (Radio City) would also boost the company's
revenue growth.
Speedier execution and speedier sales, strong revenue
Mahindra Lifespace
1,776
433
522
20.6
visibilty in short-to-long run, attractive valuations
Massive capacity expansion along with rail advantage at ICD
Navkar Corporation
2,762
194
265
36.8
as well CFS augurs well for the company
Market leadership in Hindi news genre and no. 2 viewership
ranking in English news genre, exit from the radio business,
TV Today Network
1,935
324
363
11.9
and anticipated growth in ad spends by corporates to benefit
the stock.
Source: Company, Angel Research
Market Outlook
October 07, 2016
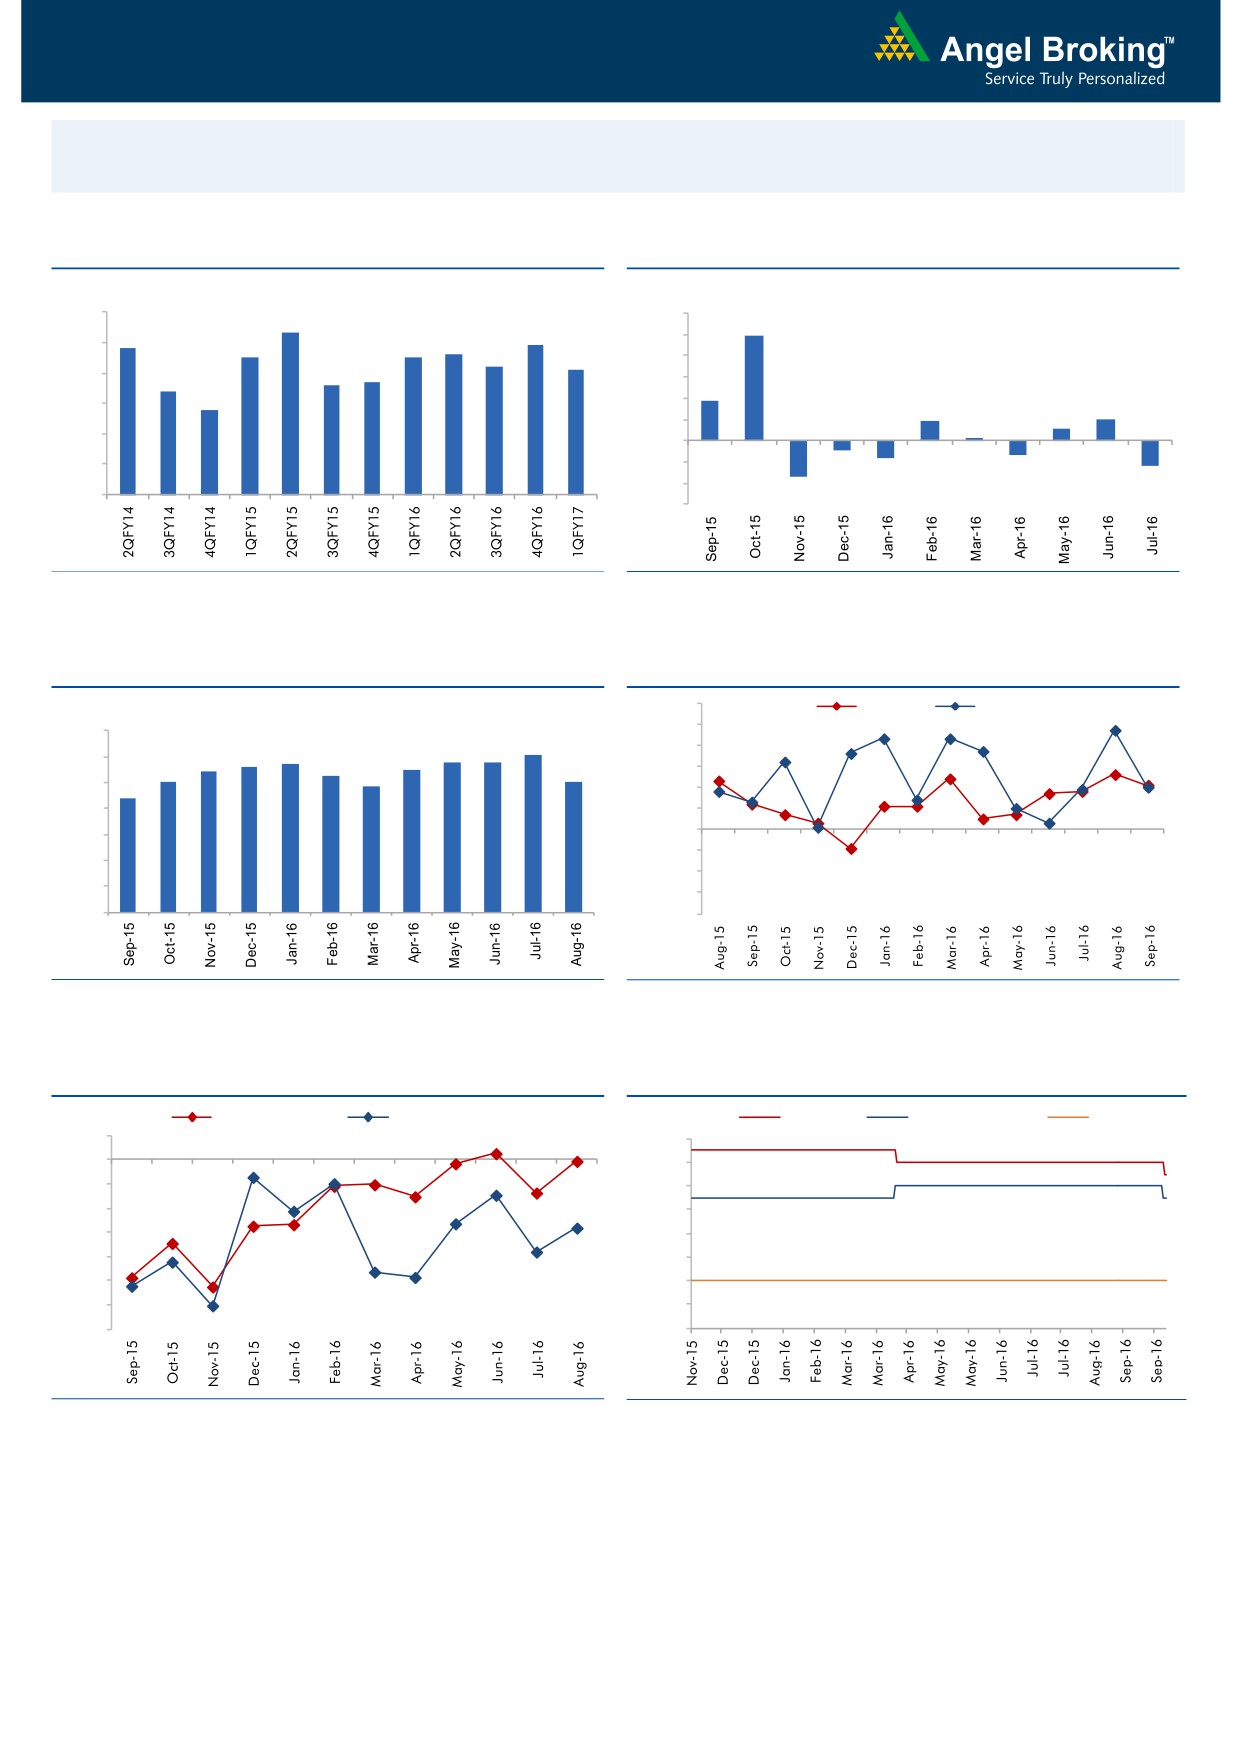
Macro watch
Exhibit 1: Quarterly GDP trends
Exhibit 2: IIP trends
(%)
(%)
9.0
12.0
8.3
9.9
7.8
7.9
8.0
7.5
7.5
7.6
10.0
7.2
7.1
8.0
6.6
6.7
7.0
6.4
6.0
3.7
5.8
6.0
4.0
1.9
2.0
1.1
2.0
0.3
5.0
-
4.0
(2.0)
(0.9)
(1.3)
(1.6)
(4.0)
(2.4)
3.0
(3.4)
(6.0)
Source: CSO, Angel Research
Source: MOSPI, Angel Research
Exhibit 3: Monthly CPI inflation trends
Exhibit 4: Manufacturing and services PMI
56.0
Mfg. PMI
Services PMI
(%)
55.0
7.0
6.1
5.7
5.8
5.8
54.0
6.0
5.4
5.6
5.5
5.0
5.3
5.1
53.0
4.8
5.0
4.4
52.0
4.0
51.0
50.0
3.0
49.0
2.0
48.0
1.0
47.0
-
46.0
Source: MOSPI, Angel Research
Source: Market, Angel Research; Note: Level above 50 indicates expansion
Exhibit 5: Exports and imports growth trends
Exhibit 6: Key policy rates
(%)
Exports yoy growth
Imports yoy growth
(%)
Repo rate
Reverse Repo rate
CRR
5.0
7.00
0.0
6.50
(5.0)
6.00
(10.0)
5.50
(15.0)
5.00
(20.0)
4.50
(25.0)
4.00
(30.0)
3.50
(35.0)
3.00
Source: Bloomberg, Angel Research
Source: RBI, Angel Research
Market Outlook
October 07, 2016
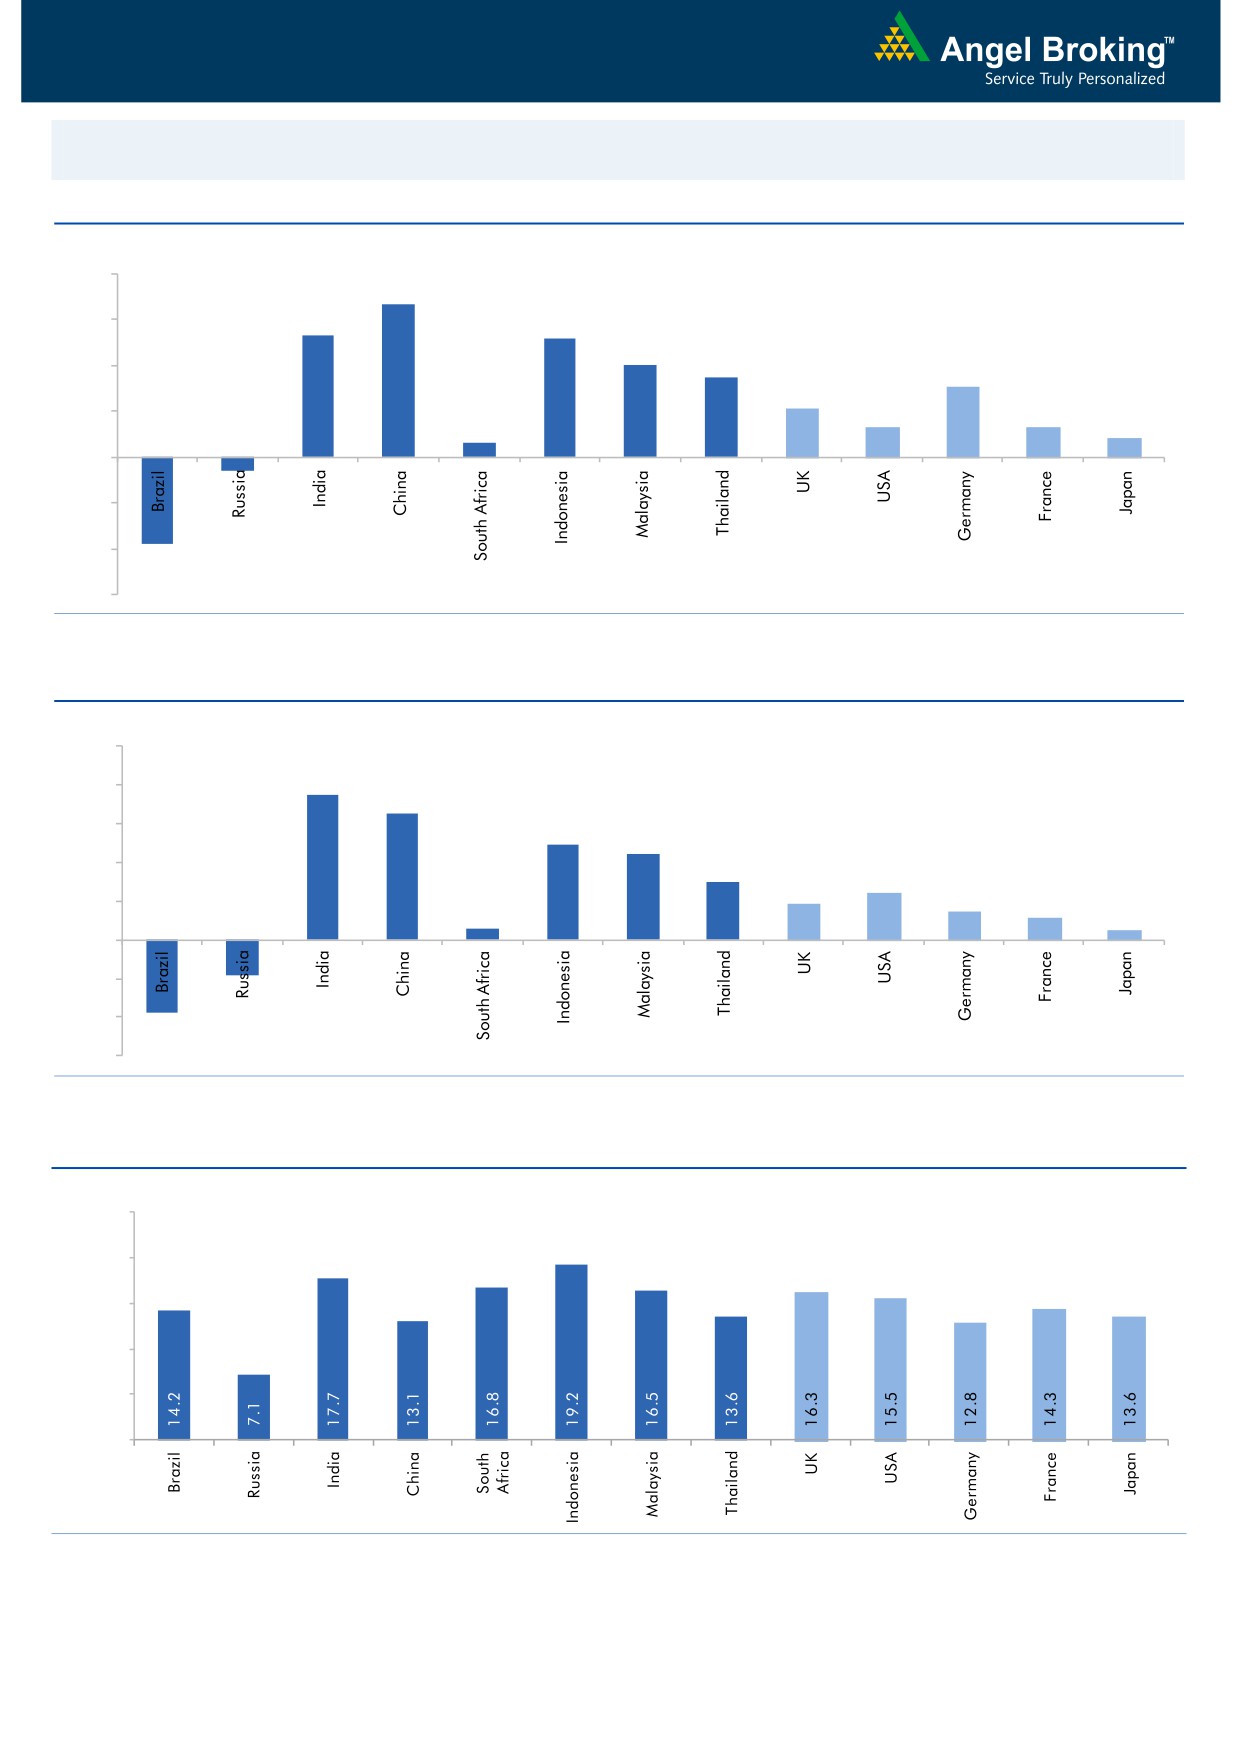
Global watch
Exhibit 1: Latest quarterly GDP Growth (%, yoy) across select developing and developed countries
(%)
8.0
6.7
6.0
5.3
0.6
5.2
4.0
3.5
4.0
3.1
2.1
2.0
1.3
1.3
0.8
-
(2.0)
(0.6)
(4.0)
(3.8)
(6.0)
Source: Bloomberg, Angel Research
Exhibit 2: 2016 GDP Growth projection by IMF (%, yoy) across select developing and developed countries
(%)
10.0
7.5
8.0
6.5
6.0
4.9
4.4
4.0
3.0
2.4
1.9
1.5
2.0
1.1
0.6
0.5
(3.8)
(1.8)
-
(2.0)
(4.0)
(6.0)
Source: IMF, Angel Research
Exhibit 3: One year forward P-E ratio across select developing and developed countries
(x)
25.0
20.0
15.0
10.0
5.0
-
Source: IMF, Angel Research
Stock Watch
October 07, 2016
Company Name
Reco
CMP
Target
Mkt Cap
Sales ( Čcr )
OPM(%)
EPS (Č)
PER(x)
P/BV(x)
RoE(%)
EV/Sales(x)
(Č)
Price ( Č)
( Č cr )
FY17E FY18E
FY17E
FY18E
FY17E
FY18E
FY17E
FY18E
FY17E
FY18E
FY17E
FY18E
FY17E
FY18E
Agri / Agri Chemical
Rallis
Neutral
233
-
4,539
1,937
2,164
13.3
14.3
9.0
11.0
25.9
21.2
4.5
3.9
18.4
19.8
2.4
2.1
United Phosphorus
Neutral
672
-
34,052
15,176
17,604
18.5
18.5
37.4
44.6
18.0
15.1
3.5
2.9
21.4
21.2
2.4
2.0
Auto & Auto Ancillary
Ashok Leyland
Buy
81
111
22,995
22,407
26,022
10.6
10.6
5.2
6.4
15.5
12.6
3.5
3.0
23.6
24.7
1.1
0.9
Bajaj Auto
Neutral
2,826
-
81,772
25,093
27,891
19.5
19.2
143.9
162.5
19.6
17.4
5.5
4.7
30.3
29.4
3.0
2.6
Bharat Forge
Neutral
930
-
21,649
7,726
8,713
20.5
21.2
35.3
42.7
26.3
21.8
4.9
4.4
18.9
20.1
2.9
2.5
Eicher Motors
Neutral
26,241
-
71,273
16,583
20,447
17.5
18.0
598.0
745.2
43.9
35.2
15.0
11.4
41.2
38.3
4.1
3.3
Gabriel India
Neutral
119
-
1,706
1,544
1,715
9.0
9.3
5.4
6.3
22.0
18.9
4.2
3.7
18.9
19.5
1.1
0.9
Hero Motocorp
Neutral
3,474
-
69,363
31,253
35,198
15.3
15.0
172.3
192.1
20.2
18.1
7.4
6.3
38.9
37.0
2.1
1.8
Jamna Auto Industries Neutral
217
-
1,733
1,486
1,620
9.8
9.9
15.0
17.2
14.5
12.6
3.2
2.7
21.8
21.3
1.2
1.1
L G Balakrishnan & Bros Neutral
612
-
961
1,302
1,432
11.6
11.9
43.7
53.0
14.0
11.6
2.0
1.8
13.8
14.2
0.8
0.8
Mahindra and Mahindra Neutral
1,372
-
85,233
46,534
53,077
11.6
11.7
67.3
78.1
20.4
17.6
3.3
2.9
15.4
15.8
1.8
1.6
Maruti
Neutral
5,712
-
172,536
69,186
82,217
14.7
14.4
198.5
241.4
28.8
23.7
5.6
4.5
20.2
20.0
2.2
1.8
Minda Industries
Neutral
325
-
2,581
2,728
3,042
9.0
9.1
68.2
86.2
4.8
3.8
1.1
0.9
23.8
24.3
1.0
0.9
Motherson Sumi
Neutral
332
-
46,614
45,896
53,687
7.8
8.3
13.0
16.1
25.5
20.6
8.2
6.6
34.7
35.4
1.1
0.9
Rane Brake Lining
Neutral
1,138
-
901
511
562
11.3
11.5
28.1
30.9
40.5
36.8
6.2
5.6
15.3
15.0
1.9
1.7
Setco Automotive
Neutral
43
-
578
741
837
13.0
13.0
15.2
17.0
2.9
2.5
0.5
0.4
15.8
16.3
1.2
1.1
Tata Motors
Neutral
551
-
159,157
300,209
338,549
8.9
8.4
42.7
54.3
12.9
10.2
2.1
1.7
15.6
17.2
0.6
0.6
TVS Motor
Neutral
384
-
18,239
13,390
15,948
6.9
7.1
12.8
16.5
30.1
23.2
7.5
5.9
26.3
27.2
1.4
1.2
Amara Raja Batteries
Accumulate
1,040
1,174
17,770
5,429
6,471
17.5
17.6
35.3
43.5
29.5
23.9
6.8
5.5
25.3
24.8
3.1
2.5
Exide Industries
Neutral
193
-
16,371
7,439
8,307
15.0
15.0
8.1
9.3
23.8
20.7
3.3
3.0
14.3
16.7
1.8
1.6
Apollo Tyres
Neutral
227
-
11,565
12,877
14,504
14.3
13.9
21.4
23.0
10.6
9.9
1.7
1.4
16.4
15.2
1.1
1.0
Ceat
Neutral
1,395
-
5,642
7,524
8,624
13.0
12.7
131.1
144.3
10.6
9.7
2.0
1.7
19.8
18.6
0.8
0.7
JK Tyres
Neutral
157
-
3,552
7,455
8,056
15.0
15.0
21.8
24.5
7.2
6.4
1.5
1.2
22.8
21.3
0.6
0.5
Swaraj Engines
Neutral
1,370
-
1,702
660
810
15.2
16.4
54.5
72.8
25.1
18.8
7.8
7.1
31.5
39.2
2.4
1.9
Subros
Neutral
137
-
823
1,488
1,681
11.7
11.9
6.4
7.2
21.5
19.2
2.3
2.1
10.8
11.4
0.8
0.7
Indag Rubber
Neutral
209
-
549
286
326
19.8
16.8
11.7
13.3
17.9
15.7
3.0
2.8
17.8
17.1
1.6
1.4
Capital Goods
ACE
Neutral
45
-
443
709
814
4.1
4.6
1.4
2.1
32.0
21.3
1.3
1.2
4.4
6.0
0.8
0.7
BEML
Buy
912
1,157
3,797
3,451
4,055
6.3
9.2
31.4
57.9
29.0
15.8
1.7
1.6
6.3
10.9
1.2
1.0
Bharat Electronics
Accumulate
1,272
1,414
30,532
8,137
9,169
16.8
17.2
58.7
62.5
21.7
20.4
3.4
3.0
44.6
46.3
2.7
2.5
Stock Watch
October 07, 2016
Company Name
Reco
CMP
Target
Mkt Cap
Sales ( Čcr )
OPM(%)
EPS (Č)
PER(x)
P/BV(x)
RoE(%)
EV/Sales(x)
(Č)
Price ( Č)
( Č cr )
FY17E
FY18E
FY17E
FY18E
FY17E
FY18E
FY17E
FY18E
FY17E
FY18E
FY17E
FY18E
FY17E
FY18E
Capital Goods
Voltas
Neutral
389
-
12,865
6,511
7,514
7.9
8.7
12.9
16.3
30.1
23.9
5.4
4.8
16.7
18.5
1.7
1.5
BGR Energy
Neutral
116
-
834
16,567
33,848
6.0
5.6
7.8
5.9
14.8
19.6
0.8
0.8
4.7
4.2
0.2
0.1
BHEL
Neutral
136
-
33,349
28,797
34,742
-
2.8
2.3
6.9
59.2
19.8
1.0
1.0
1.3
4.8
0.8
0.6
Blue Star
Neutral
574
-
5,473
4,351
5,024
6.4
7.1
17.2
20.6
33.4
27.8
21.7
18.1
23.1
24.1
1.3
1.1
Crompton Greaves
Neutral
77
-
4,826
5,777
6,120
5.9
7.0
3.3
4.5
23.3
17.1
1.0
1.0
4.4
5.9
0.8
0.7
Greaves Cotton
Neutral
128
-
3,115
1,755
1,881
16.8
16.9
7.8
8.5
16.4
15.0
3.3
3.0
20.6
20.9
1.5
1.3
Inox Wind
Buy
213
286
4,731
5,605
6,267
15.7
16.4
24.8
30.0
8.6
7.1
2.4
1.8
25.9
24.4
0.9
0.7
KEC International
Neutral
125
-
3,214
9,294
10,186
7.9
8.1
9.9
11.9
12.6
10.5
1.9
1.6
15.6
16.3
0.6
0.5
Thermax
Neutral
905
-
10,778
5,421
5,940
7.3
7.3
25.7
30.2
35.2
30.0
4.3
3.9
12.2
13.1
1.9
1.7
VATech Wabag
Buy
560
681
3,052
3,136
3,845
8.9
9.1
26.0
35.9
21.5
15.6
2.7
2.3
13.4
15.9
0.9
0.7
Cement
ACC
Neutral
1,629
-
30,597
11,225
13,172
13.2
16.9
44.5
75.5
36.6
21.6
3.5
3.2
11.2
14.2
2.7
2.3
Ambuja Cements
Neutral
253
-
50,237
9,350
10,979
18.2
22.5
5.8
9.5
43.6
26.6
3.7
3.3
10.2
12.5
5.4
4.6
India Cements
Neutral
157
-
4,827
4,364
4,997
18.5
19.2
7.9
11.3
19.9
13.9
1.4
1.4
8.0
8.5
1.9
1.6
JK Cement
Neutral
908
-
6,350
4,398
5,173
15.5
17.5
31.2
55.5
29.1
16.4
3.5
3.0
12.0
15.5
2.0
1.7
J K Lakshmi Cement
Neutral
506
-
5,951
2,913
3,412
14.5
19.5
7.5
22.5
67.4
22.5
4.2
3.5
12.5
18.0
2.6
2.2
Orient Cement
Neutral
222
-
4,549
2,114
2,558
18.5
20.5
8.1
11.3
27.4
19.7
4.0
3.4
9.0
14.0
2.8
2.2
UltraTech Cement
Neutral
3,963
-
108,764
25,768
30,385
21.0
23.5
111.0
160.0
35.7
24.8
4.6
4.0
13.5
15.8
4.3
3.6
Construction
ITNL
Neutral
106
-
3,475
8,946
10,017
31.0
31.6
8.1
9.1
13.0
11.6
0.5
0.5
4.2
5.0
3.7
3.5
KNR Constructions
Neutral
787
-
2,213
1,385
1,673
14.7
14.0
41.2
48.5
19.1
16.2
3.6
3.1
14.9
15.2
1.7
1.4
Larsen & Toubro
Buy
1,455
1,700
135,565
67,665
77,249
10.7
11.5
57.3
71.2
25.4
20.4
2.3
2.2
12.6
14.3
2.2
1.9
Gujarat Pipavav Port
Neutral
186
-
8,982
705
788
52.2
51.7
5.0
5.6
37.2
33.2
3.7
3.3
11.2
11.2
12.4
10.6
Nagarjuna Const.
Neutral
86
-
4,781
8,842
9,775
9.1
8.8
5.3
6.4
16.2
13.4
1.3
1.2
8.2
9.1
0.7
0.6
PNC Infratech
Accumulate
128
143
3,291
2,350
2,904
13.1
13.2
9.0
8.8
14.3
14.6
0.5
0.5
15.9
13.9
1.5
1.2
Simplex Infra
Neutral
341
-
1,687
6,829
7,954
10.5
10.5
31.4
37.4
10.9
9.1
1.1
1.0
9.9
13.4
0.7
0.6
Power Mech Projects
Neutral
494
-
727
1,801
2,219
12.7
14.6
72.1
113.9
6.9
4.3
1.3
1.1
16.8
11.9
0.4
0.3
Sadbhav Engineering
Neutral
285
-
4,881
3,598
4,140
10.3
10.6
9.0
11.9
31.6
23.9
3.3
2.9
9.9
11.9
1.6
1.4
NBCC
Neutral
273
-
16,362
7,428
9,549
7.9
8.6
8.2
11.0
33.3
24.8
1.7
1.3
28.2
28.7
1.9
1.4
MEP Infra
Neutral
42
-
678
1,877
1,943
30.6
29.8
3.0
4.2
13.9
9.9
6.7
4.5
0.6
0.6
1.7
1.6
SIPL
Neutral
106
-
3,749
1,036
1,252
65.5
66.2
(8.4)
(5.6)
4.0
4.6
(22.8)
(15.9)
11.8
9.8
Stock Watch
October 07, 2016
Company Name
Reco
CMP
Target
Mkt Cap
Sales ( Čcr )
OPM(%)
EPS (Č)
PER(x)
P/BV(x)
RoE(%)
EV/Sales(x)
(Č)
Price ( Č)
( Č cr )
FY17E
FY18E
FY17E
FY18E
FY17E
FY18E
FY17E
FY18E
FY17E
FY18E
FY17E
FY18E
FY17E
FY18E
Construction
Engineers India
Neutral
258
-
8,686
1,725
1,935
16.0
19.1
11.4
13.9
22.6
18.6
3.1
3.0
13.4
15.3
4.0
3.5
Financials
Axis Bank
Buy
531
630
126,725
46,932
53,575
3.5
3.4
32.4
44.6
16.4
11.9
2.1
1.8
13.6
16.5
-
-
Bank of Baroda
Neutral
165
-
37,938
19,980
23,178
1.8
1.8
11.5
17.3
14.3
9.5
1.6
1.4
8.3
10.1
-
-
Canara Bank
Neutral
330
-
17,913
15,225
16,836
1.8
1.8
14.5
28.0
22.8
11.8
1.6
1.3
5.8
8.5
-
-
Dewan Housing Finance Accumulate
295
325
8,608
2,225
2,688
2.9
2.9
29.7
34.6
9.9
8.5
1.6
1.4
16.1
16.8
-
-
Equitas Holdings
Buy
185
235
6,204
939
1,281
11.7
11.5
5.8
8.2
31.9
22.6
2.7
2.5
10.9
11.5
-
-
Federal Bank
Neutral
73
-
12,543
9,353
10,623
2.9
2.9
4.4
5.8
16.6
12.6
1.6
1.4
9.5
11.0
-
-
HDFC
Neutral
1,424
-
225,098
11,475
13,450
3.4
3.4
45.3
52.5
31.4
27.1
6.1
5.4
20.2
20.5
-
-
HDFC Bank
Accumulate
1,283
1,350
324,759
46,097
55,433
4.5
4.5
58.4
68.0
22.0
18.9
3.9
3.2
18.8
18.6
-
-
ICICI Bank
Neutral
252
-
146,354
39,029
45,903
3.3
3.3
16.7
16.3
15.1
15.4
1.9
1.7
10.1
12.4
-
-
LIC Housing Finance
Neutral
587
-
29,634
3,712
4,293
2.6
2.5
39.0
46.0
15.1
12.8
2.8
2.4
19.9
20.1
-
-
Punjab Natl.Bank
Neutral
142
-
30,185
23,532
23,595
2.3
2.4
6.8
12.6
20.9
11.3
3.2
2.3
3.3
6.5
-
-
RBL Bank
Accumulate
304
325
11,253
1,783
2,309
2.6
2.6
12.7
16.4
24.0
18.6
2.6
2.3
12.8
13.3
-
-
South Ind.Bank
Neutral
25
-
3,342
6,435
7,578
2.5
2.5
2.7
3.1
9.2
8.0
1.2
1.0
10.1
11.2
-
-
St Bk of India
Neutral
257
-
199,387
88,650
98,335
2.6
2.6
13.5
18.8
19.0
13.7
1.8
1.6
7.0
8.5
-
-
Union Bank
Neutral
149
-
10,264
13,450
14,925
2.3
2.3
25.5
34.5
5.9
4.3
0.9
0.7
7.5
10.2
-
-
Yes Bank
Neutral
1,280
-
53,898
8,978
11,281
3.3
3.4
74.0
90.0
17.3
14.2
3.3
2.8
17.0
17.2
-
-
FMCG
Asian Paints
Neutral
1,208
-
115,876
17,128
18,978
16.8
16.4
19.1
20.7
63.3
58.4
22.0
20.8
34.8
35.5
6.7
6.0
Britannia
Neutral
3,465
-
41,577
9,795
11,040
14.6
14.9
80.3
94.0
43.2
36.9
17.7
13.7
41.2
-
4.1
3.6
Colgate
Neutral
977
-
26,570
4,605
5,149
23.4
23.4
23.8
26.9
41.1
36.3
22.7
17.8
64.8
66.8
5.7
5.1
Dabur India
Neutral
286
-
50,294
8,315
9,405
19.8
20.7
8.1
9.2
35.3
31.1
9.8
8.2
31.6
31.0
5.7
5.0
GlaxoSmith Con*
Neutral
6,187
-
26,020
4,350
4,823
21.2
21.4
179.2
196.5
34.5
31.5
9.2
7.8
27.1
26.8
5.4
4.8
Godrej Consumer
Neutral
1,633
-
55,604
10,235
11,428
18.4
18.6
41.1
44.2
39.7
36.9
8.8
7.4
24.9
24.8
5.5
4.9
HUL
Neutral
884
-
191,254
35,252
38,495
17.6
17.4
20.4
21.9
43.3
40.4
35.6
31.2
82.2
77.3
5.2
4.8
ITC
Buy
238
283
287,285
40,059
44,439
39.0
39.2
9.1
10.1
26.2
23.6
7.1
6.3
27.2
26.5
6.7
6.0
Marico
Neutral
287
-
36,983
6,430
7,349
18.8
19.5
6.4
7.7
44.8
37.2
13.5
11.4
33.2
32.5
5.6
4.8
Nestle*
Neutral
6,710
-
64,694
10,073
11,807
20.7
21.5
124.8
154.2
53.8
43.5
22.1
19.9
34.8
36.7
6.2
5.3
Tata Global
Neutral
151
-
9,524
8,675
9,088
9.8
9.8
7.4
8.2
20.4
18.4
2.3
2.2
7.9
8.1
1.0
1.0
Procter & Gamble
Accumulate
6,929
7,369
22,493
2,939
3,342
23.2
23.0
146.2
163.7
47.4
42.3
106.1
101.8
25.3
23.5
7.2
6.3
Hygiene
Stock Watch
October 07, 2016
Company Name
Reco
CMP
Target
Mkt Cap
Sales ( Čcr )
OPM(%)
EPS (Č)
PER(x)
P/BV(x)
RoE(%)
EV/Sales(x)
(Č)
Price ( Č)
( Č cr )
FY17E FY18E
FY17E
FY18E
FY17E
FY18E
FY17E
FY18E
FY17E
FY18E
FY17E
FY18E
FY17E
FY18E
IT
HCL Tech^
Buy
801
1,000
113,044
49,242
57,168
20.5
20.5
55.7
64.1
14.4
12.5
2.9
2.2
20.3
17.9
2.2
1.7
Infosys
Buy
1,027
1,370
235,816
69,934
79,025
27.5
27.5
64.8
72.0
15.8
14.3
3.5
3.2
22.0
22.3
2.8
2.4
TCS
Buy
2,384
3,004
469,799
121,684
136,286
27.3
27.3
135.0
150.1
17.7
15.9
5.9
5.4
33.2
33.9
3.6
3.2
Tech Mahindra
Buy
421
700
40,861
30,347
33,685
17.0
17.0
37.5
41.3
11.2
10.2
2.5
2.1
21.8
20.7
1.1
0.9
Wipro
Buy
478
680
116,116
51,631
55,822
21.7
17.9
35.9
36.9
13.3
13.0
2.8
2.6
19.0
18.1
1.9
1.7
Media
D B Corp
Neutral
388
-
7,126
2,297
2,590
27.4
28.2
21.0
23.4
18.5
16.6
4.3
3.7
23.7
23.1
2.9
2.5
HT Media
Neutral
85
-
1,988
2,693
2,991
12.6
12.9
7.9
9.0
10.8
9.5
0.9
0.9
7.8
8.3
0.3
0.2
Jagran Prakashan
Accumulate
199
225
6,494
2,355
2,635
28.0
28.0
10.8
12.5
18.4
15.9
4.0
3.5
21.7
21.7
2.8
2.4
Sun TV Network
Neutral
524
-
20,642
2,850
3,265
70.1
71.0
26.2
30.4
20.0
17.2
5.1
4.5
24.3
25.6
6.8
5.8
Hindustan Media
Neutral
297
-
2,182
1,016
1,138
24.3
25.2
27.3
30.1
10.9
9.9
2.1
1.8
16.2
15.8
1.5
1.3
Ventures
TV Today Network
Accumulate
324
363
1,935
637
743
27.5
27.5
18.4
21.4
17.7
15.2
3.1
2.6
17.4
17.2
2.6
2.2
Metals & Mining
Coal India
Neutral
319
-
201,239
84,638
94,297
21.4
22.3
24.5
27.1
13.0
11.8
5.4
5.2
42.6
46.0
1.9
1.7
Hind. Zinc
Neutral
250
-
105,591
14,252
18,465
55.9
48.3
15.8
21.5
15.8
11.6
2.6
2.3
17.0
20.7
7.4
5.7
Hindalco
Neutral
158
-
32,678
107,899
112,095
7.4
8.2
9.2
13.0
17.2
12.2
0.8
0.8
4.8
6.6
0.8
0.8
JSW Steel
Neutral
1,764
-
42,643
53,201
58,779
16.1
16.2
130.6
153.7
13.5
11.5
1.8
1.6
14.0
14.4
1.6
1.4
NMDC
Neutral
116
-
45,812
6,643
7,284
44.4
47.7
7.1
7.7
16.3
15.0
1.4
1.4
8.8
9.2
4.7
4.2
SAIL
Neutral
48
-
19,762
47,528
53,738
(0.7)
2.1
(1.9)
2.6
18.4
0.5
0.5
(1.6)
3.9
1.3
1.2
Vedanta
Neutral
198
-
58,553
71,744
81,944
19.2
21.7
13.4
20.1
14.7
9.8
1.3
1.1
8.4
11.3
1.2
0.9
Tata Steel
Neutral
389
-
37,809
121,374
121,856
7.2
8.4
18.6
34.3
20.9
11.4
1.3
1.2
6.1
10.1
1.0
0.9
Oil & Gas
Cairn India
Neutral
227
-
42,616
9,127
10,632
4.3
20.6
8.8
11.7
25.8
19.4
0.8
0.8
3.3
4.2
6.1
5.1
GAIL
Neutral
415
-
52,591
56,220
65,198
9.3
10.1
27.1
33.3
15.3
12.5
1.4
1.3
9.3
10.7
1.1
0.9
ONGC
Neutral
269
-
229,886
137,222
152,563
15.0
21.8
19.5
24.1
13.8
11.2
1.2
1.1
8.5
10.1
2.0
1.7
Indian Oil Corp
Neutral
650
-
157,866
373,359
428,656
5.9
5.5
54.0
59.3
12.0
11.0
1.9
1.7
16.0
15.6
0.6
0.5
Reliance Industries
Neutral
1,111
-
360,268
301,963
358,039
12.1
12.6
87.7
101.7
12.7
10.9
1.3
1.2
10.7
11.3
1.7
1.4
Pharmaceuticals
Alembic Pharma
Neutral
679
-
12,791
3,483
4,083
20.2
21.4
24.3
30.4
27.9
22.3
6.4
5.1
25.5
25.3
3.6
3.0
Aurobindo Pharma
Neutral
857
-
50,126
15,720
18,078
23.7
23.7
41.4
47.3
20.7
18.1
5.4
4.2
29.6
26.1
3.4
3.0
Aventis*
Neutral
4,165
-
9,592
2,357
2,692
17.3
17.3
153.5
169.2
27.1
24.6
4.6
3.7
25.8
28.4
3.8
3.1
Cadila Healthcare
Neutral
387
-
39,639
11,126
13,148
22.0
22.0
17.1
20.0
22.6
19.4
5.8
4.6
28.8
26.6
3.6
2.9
Cipla
Sell
579
490
46,539
15,378
18,089
17.4
18.4
21.6
27.2
26.8
21.3
3.5
3.0
13.7
15.2
3.2
2.7
Stock Watch
October 07, 2016
Company Name
Reco
CMP
Target
Mkt Cap
Sales ( Čcr )
OPM(%)
EPS (Č)
PER(x)
P/BV(x)
RoE(%)
EV/Sales(x)
(Č)
Price ( Č)
( Č cr )
FY17E FY18E
FY17E
FY18E
FY17E
FY18E
FY17E
FY18E
FY17E
FY18E
FY17E
FY18E
FY17E
FY18E
Pharmaceuticals
Dr Reddy's
Neutral
3,078
-
50,996
16,043
18,119
23.1
24.7
126.0
157.8
24.4
19.5
3.6
3.1
15.7
17.1
3.1
2.7
Dishman Pharma
Sell
248
45
4,003
1,718
1,890
22.7
22.8
9.5
11.3
26.1
22.0
2.5
2.3
10.1
10.9
2.8
2.4
GSK Pharma*
Neutral
2,916
-
24,696
3,528
3,811
16.6
18.8
51.8
59.4
56.3
49.1
15.1
15.0
26.3
30.6
6.8
6.3
Indoco Remedies
Sell
314
225
2,889
1,112
1,289
18.2
18.2
13.2
15.6
23.8
20.1
4.2
3.6
19.2
19.2
2.7
2.3
Ipca labs
Neutral
609
-
7,679
3,303
3,799
15.3
15.3
17.3
19.7
35.2
30.9
3.1
2.8
9.1
9.4
2.5
2.1
Lupin
Buy
1,485
1,809
66,934
15,912
18,644
26.4
26.7
58.1
69.3
25.6
21.4
5.0
4.1
21.4
20.9
4.3
3.5
Sun Pharma
Buy
753
944
181,188
31,129
35,258
30.0
30.9
28.0
32.8
26.9
23.0
4.1
3.4
18.7
18.9
5.4
4.6
Power
Tata Power
Neutral
79
-
21,380
36,916
39,557
17.4
27.1
5.1
6.3
15.5
12.6
1.4
1.3
9.0
10.3
1.6
1.4
NTPC
Neutral
149
-
122,899
86,605
95,545
17.5
20.8
11.8
13.4
12.6
11.1
1.3
1.2
10.5
11.1
2.8
2.8
Power Grid
Neutral
178
-
93,070
25,763
29,762
74.3
73.1
14.8
17.3
12.0
10.3
1.9
1.7
16.9
17.5
7.9
7.5
Real Estate
Prestige Estate
Neutral
206
-
7,733
4,707
5,105
25.2
26.0
10.3
13.0
20.0
15.9
1.6
1.5
10.3
10.2
2.8
2.5
MLIFE
Buy
433
522
1,776
1,152
1,300
22.7
24.6
29.9
35.8
14.5
12.1
1.1
1.0
7.6
8.6
2.3
1.9
Telecom
Bharti Airtel
Neutral
323
-
129,056
105,086
114,808
34.5
34.7
12.2
16.4
26.5
19.7
1.8
1.7
6.8
8.4
2.1
1.9
Idea Cellular
Neutral
80
-
28,770
40,133
43,731
37.2
37.1
6.4
6.5
12.5
12.3
1.0
1.0
8.2
7.6
1.7
1.5
zOthers
Abbott India
Neutral
4,821
-
10,245
3,153
3,583
14.1
14.4
152.2
182.7
31.7
26.4
155.5
132.8
25.6
26.1
3.0
2.5
Bajaj Electricals
Buy
263
306
2,654
5,099
5,805
5.6
5.9
11.4
14.6
23.1
18.0
3.1
2.7
13.4
15.1
0.5
0.5
Finolex Cables
Neutral
447
-
6,842
2,883
3,115
12.0
12.1
14.2
18.6
31.5
24.1
16.8
14.7
15.8
14.6
2.1
1.9
Goodyear India*
Neutral
879
-
2,027
1,598
1,704
10.4
10.2
49.4
52.6
17.8
16.7
82.1
72.0
18.2
17.0
1.0
135.9
Hitachi
Neutral
1,588
-
4,317
2,081
2,433
8.8
8.9
33.4
39.9
47.5
39.8
38.4
32.0
22.1
21.4
2.1
1.7
Jyothy Laboratories
Neutral
369
-
6,708
1,440
2,052
11.5
13.0
8.5
10.0
43.5
37.0
10.5
9.8
18.6
19.3
4.9
3.4
Page Industries
Neutral
15,835
-
17,663
2,450
3,124
20.1
17.6
299.0
310.0
53.0
51.1
352.7
269.2
47.1
87.5
7.3
5.7
Relaxo Footwears
Neutral
452
-
5,422
2,085
2,469
9.2
8.2
7.6
8.0
59.8
56.8
23.2
19.8
17.9
18.8
2.7
2.3
Siyaram Silk Mills
Neutral
1,433
-
1,343
1,799
2,040
11.6
11.7
104.9
122.4
13.7
11.7
2.2
1.9
16.4
16.4
0.9
0.8
Styrolution ABS India*
Neutral
609
-
1,070
1,440
1,537
9.2
9.0
40.6
42.6
15.0
14.3
38.3
34.8
12.3
11.6
0.7
0.6
TVS Srichakra
Neutral
3,969
-
3,039
2,304
2,614
13.7
13.8
231.1
266.6
17.2
14.9
446.0
351.2
33.9
29.3
1.3
1.1
HSIL
Neutral
345
-
2,491
2,384
2,515
15.8
16.3
15.3
19.4
22.5
17.8
22.4
19.3
7.8
9.3
1.2
1.1
Kirloskar Engines India
Neutral
353
-
5,105
2,554
2,800
9.9
10.0
10.5
12.1
33.6
29.2
14.1
13.3
10.7
11.7
1.6
1.5
Ltd
M M Forgings
Neutral
445
-
537
546
608
20.4
20.7
41.3
48.7
10.8
9.1
61.0
54.0
16.6
17.0
0.8
0.7
Banco Products (India)
Neutral
216
-
1,542
1,353
1,471
12.3
12.4
14.5
16.3
14.9
13.2
20.5
18.5
14.5
14.6
1.1
116.0
Stock Watch
October 07, 2016
Company Name
Reco
CMP
Target
Mkt Cap
Sales ( Čcr )
OPM(%)
EPS (Č)
PER(x)
P/BV(x)
RoE(%)
EV/Sales(x)
(Č)
Price ( Č)
( Č cr )
FY17E
FY18E
FY17E
FY18E
FY17E
FY18E
FY17E
FY18E
FY17E
FY18E
FY17E
FY18E
FY17E
FY18E
zOthers
Competent Automobiles Neutral
192
-
118
1,137
1,256
3.1
2.7
28.0
23.6
6.9
8.1
36.9
33.4
14.3
11.5
0.1
0.1
Nilkamal
Neutral
1,323
-
1,975
1,995
2,165
10.7
10.4
69.8
80.6
19.0
16.4
75.6
65.7
16.6
16.5
1.0
0.9
Visaka Industries
Neutral
187
-
297
1,051
1,138
10.3
10.4
21.0
23.1
8.9
8.1
24.0
22.5
9.0
9.2
0.5
0.5
Transport Corporation of
Neutral
187
-
1,431
2,671
2,911
8.5
8.8
13.9
15.7
13.5
11.9
1.8
1.6
13.7
13.8
0.6
0.6
India
Elecon Engineering
Neutral
63
-
685
1,482
1,660
13.7
14.5
3.9
5.8
16.1
10.8
3.8
3.5
7.8
10.9
0.8
0.7
Surya Roshni
Neutral
225
-
985
3,342
3,625
7.8
7.5
17.3
19.8
13.0
11.4
24.7
19.8
10.5
10.8
0.6
0.5
MT Educare
Neutral
144
-
572
366
417
17.7
18.2
9.4
10.8
15.3
13.3
3.4
3.0
22.2
22.3
1.5
1.3
Radico Khaitan
Neutral
133
-
1,763
1,659
1,802
13.0
13.2
6.3
7.4
20.9
18.0
1.8
1.7
8.6
9.3
1.5
1.4
Garware Wall Ropes
Neutral
543
-
1,189
873
938
12.9
13.1
30.9
34.9
17.6
15.6
2.8
2.4
15.7
15.2
1.3
1.2
Wonderla Holidays
Neutral
400
-
2,260
287
355
38.0
40.0
11.3
14.2
35.4
28.2
5.1
4.4
21.4
23.9
7.6
6.1
Linc Pen & Plastics
Neutral
282
-
417
382
420
9.3
9.5
13.5
15.7
20.9
18.0
3.6
3.1
17.1
17.3
1.2
1.0
The Byke Hospitality
Neutral
190
-
761
287
384
20.5
20.5
7.6
10.7
25.0
17.7
5.2
4.2
20.7
23.5
2.7
2.0
Interglobe Aviation
Neutral
937
-
33,767
21,122
26,005
14.5
27.6
110.7
132.1
8.5
7.1
50.7
36.2
168.5
201.1
1.6
1.2
Coffee Day Enterprises
Neutral
229
-
4,721
2,964
3,260
20.5
21.2
4.7
8.0
-
28.6
2.7
2.4
5.5
8.5
2.0
1.8
Ltd
Navneet Education
Neutral
101
-
2,396
1,062
1,147
24.0
24.0
6.1
6.6
16.5
15.2
3.4
3.0
20.6
19.8
2.3
2.2
Navkar Corporation
Buy
194
265
2,762
408
612
42.9
42.3
6.8
11.5
28.6
16.8
2.0
1.8
6.9
10.5
7.7
5.1
UFO Moviez
Neutral
465
-
1,283
619
685
33.2
33.4
30.0
34.9
15.5
13.3
2.1
1.9
13.8
13.9
1.8
1.4
VRL Logistics
Neutral
312
-
2,849
1,902
2,119
16.7
16.6
14.6
16.8
21.4
18.6
4.7
4.1
21.9
22.2
1.6
1.4
Team Lease Serv.
Neutral
1,079
-
1,845
3,229
4,001
1.5
1.8
22.8
32.8
47.4
32.9
5.1
4.4
10.7
13.4
0.5
0.4
S H Kelkar & Co.
Neutral
290
-
4,196
1,036
1,160
15.1
15.0
6.1
7.2
47.5
40.4
5.1
4.7
10.7
11.5
3.9
3.5
Quick Heal
Neutral
241
-
1,685
408
495
27.3
27.0
7.7
8.8
31.1
27.4
2.9
2.9
9.3
10.6
3.3
2.7
Narayana Hrudaya
Neutral
338
-
6,904
1,873
2,166
11.5
11.7
2.6
4.0
127.7
85.2
7.8
7.1
6.1
8.3
3.8
3.3
Manpasand Bever.
Neutral
743
-
3,719
836
1,087
19.6
19.4
16.9
23.8
44.0
31.2
5.3
4.6
12.0
14.8
4.2
3.1
Parag Milk Foods
Neutral
305
-
2,568
1,919
2,231
9.3
9.6
9.5
12.9
32.3
23.6
5.0
4.1
15.5
17.5
1.5
1.3
Mirza International
Buy
96
113
1,154
1,024
1,148
18.0
18.0
6.9
8.0
13.9
12.0
2.4
2.0
16.6
16.2
1.3
1.2
Asian Granito
Buy
282
351
848
1,118
1,220
11.8
12.0
13.0
16.0
21.7
17.7
2.1
1.9
9.7
10.7
1.0
0.9
Source: Company, Angel Research; Note: *December year end; #September year end; &October year end; Price as on October 06, 2016
Market Outlook
October 07, 2016
Research Team Tel: 022 - 39357800
DISCLAIMER
Angel Broking Private Limited (hereinafter referred to as “Angel”) is a registered Member of National Stock Exchange of India
Limited,Bombay Stock Exchange Limited and Metropolitan Stock Exchange Limited. It is also registered as a Depository Participant with
CDSL and Portfolio Manager with SEBI. It also has registration with AMFI as a Mutual Fund Distributor. Angel Broking Private Limited is a
registered entity with SEBI for Research Analyst in terms of SEBI (Research Analyst) Regulations, 2014 vide registration number
INH000000164. Angel or its associates has not been debarred/ suspended by SEBI or any other regulatory authority for accessing
/dealing in securities Market. Angel or its associates/analyst has not received any compensation / managed or
co-managed public offering of securities of the company covered by Analyst during the past twelve months.
This document is solely for the personal information of the recipient, and must not be singularly used as the basis of any investment
decision. Nothing in this document should be construed as investment or financial advice. Each recipient of this document should make
such investigations as they deem necessary to arrive at an independent evaluation of an investment in the securities of the companies
referred to in this document (including the merits and risks involved), and should consult their own advisors to determine the merits and
risks of such an investment.
Reports based on technical and derivative analysis center on studying charts of a stock's price movement, outstanding positions and
trading volume, as opposed to focusing on a company's fundamentals and, as such, may not match with a report on a company's
fundamentals. Investors are advised to refer the Fundamental and Technical Research Reports available on our website to evaluate the
contrary view, if any.
The information in this document has been printed on the basis of publicly available information, internal data and other reliable
sources believed to be true, but we do not represent that it is accurate or complete and it should not be relied on as such, as this
document is for general guidance only. Angel Broking Pvt. Limited or any of its affiliates/ group companies shall not be in any way
responsible for any loss or damage that may arise to any person from any inadvertent error in the information contained in this report.
Angel Broking Pvt. Limited has not independently verified all the information contained within this document. Accordingly, we cannot
testify, nor make any representation or warranty, express or implied, to the accuracy, contents or data contained within this document.
While Angel Broking Pvt. Limited endeavors to update on a reasonable basis the information discussed in this material, there may be
regulatory, compliance, or other reasons that prevent us from doing so.
This document is being supplied to you solely for your information, and its contents, information or data may not be reproduced,
redistributed or passed on, directly or indirectly.
Neither Angel Broking Pvt. Limited, nor its directors, employees or affiliates shall be liable for any loss or damage that may arise from
or in connection with the use of this information.